
The GOP Won the Spending War While No One Was Looking
By MATT SHAPIRO
In an election season defined by frustration with the government and elected officials, one of the most frequent questions I hear in opposition to Republican governance is this:
“We elected these Republicans into office, gave them both Congress and the Senate. And what have they done for us?”
I don’t approach most questions as rhetorical, even when they are meant to be. I use numbers, and this question is no exception.
When I first came into the political scene, it was through my interest in numbers. My first snarky comment was in the form of an absurd little internet video that made a light mockery of some of the empty promises to reign in spending from the Obama administration. Obama promised to find $100 million in cuts to make to a nearly $4 trillion budget. I found the paucity of that promise to reduce spending funny in light of the enormity of scope of the federal government.
I followed this up with a dive into Obama’s first budget. This first budget stunned me in that, while the Obama administration was predicting a rather stunning and rapid recovery from the Great Recession, he was also predicting enormous federal spending increases as far as the eye could see.
It seemed strange that the answer to fixing the recession was “more spending” and then, after the recession was fixed, the answer was still “more spending.”
A president’s budget proposal tends to be a curious document that acts as part wishful thinking and part a projection of hope into the future. For example, Bush’s last budget proposal showed a federal government that was on track to produce a balanced budget within a few years. Obama’s budget, on the other hand, anticipated a massive spending increase in the first year (due to stimulus spending) followed by pretty typical increases of about 6 percent per year.
That “6 percent” is important because in 2009 it was the rate at which federal spending had grown year over year for almost 30 years. So that is the number the Obama team used as their standard for how quickly spending should keep growing.
But after Republicans took control of the House of Representatives in 2011, despite what you may have heard, they really did put a brake on federal spending. A really good brake. In fact, since 2011, federal spending has increased at only 1.3 percent per year … the slowest rate since the aftermath of World War II.
This might not seem like a big difference. After all, spending is still growing, isn’t it? But capping the spending increases by that much year over hear has a massive cumulative effect. Consider what Obama projected in his budgets against what the Republican Congress gave him.
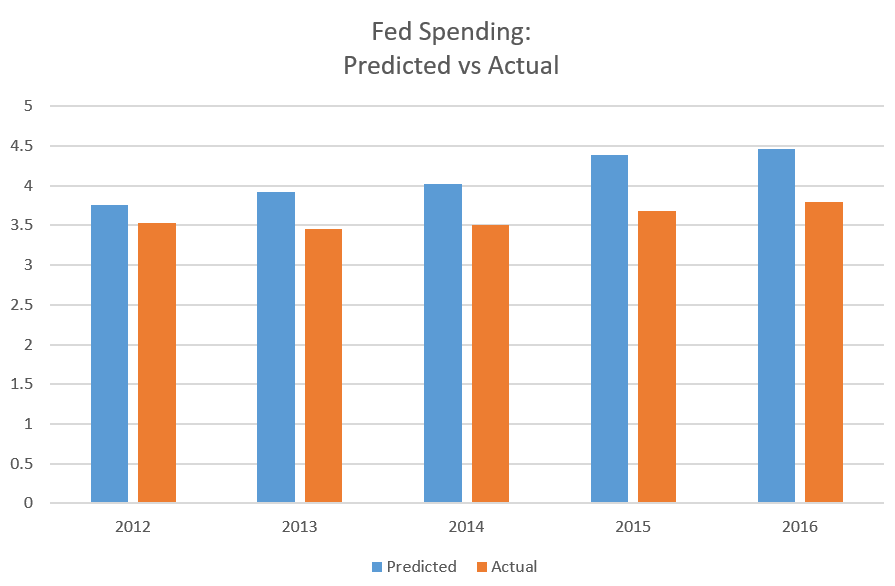 2012 was the first fiscal year that Republicans were able to vote on after gaining control of the House. The y-axis is in “trillions” but I didn’t label it properly because, at my core, I am a lazy person.
The projected federal spending number in this chart is the initial spending projection for those years taken from Obama’s budgets. It represents how the Obama team anticipated to spend given a standard 6 percent yearly increase in spending. The orange bar is what the federal government actually spent.
In 2009, Obama promised to cut federal spending by $100 million, which sounds big but is actually hilariously small in terms of federal spending. By contrast, by 2012 (the first fiscal year the majority GOP could even influence), the Republicans had slashed Obama’s budget expectations by $217 billion … more than 2,000 times that amount.
And that was just the beginning.
The difference between Obama’s 2015 spending projection and what was actually spent was an astounding $697 billion dollars. That’s more money than we spent on Medicaid.
Let that sink in.
In five years, the Republicans managed to hold back Obama’s spending increases by more money than if they actually got rid of Medicaid. And so far 2016 looks like it will hold to that trend.
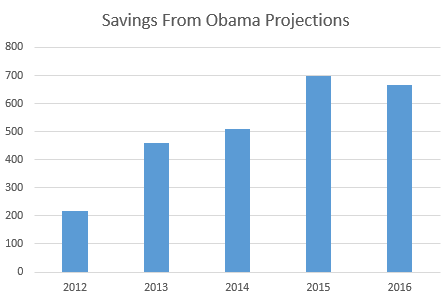 The 2016 number is a projection of current spending trends through to the end of the 2016 fiscal year. The y-axis is in billions. I refer you to the previous “lazy” comment.
If you took the difference between Obama’s projected spending and the actual spending appropriated by Congress for all five years, it’s a jaw-dropping difference of $2.5 trillion.
Obama held a press conference to announce his plan to reduce spending by $100 million. If the GOP Congress had held a press conference every time they actually reduced spending from Obama’s projections by $100 million, they could have held a press conference every two hours of every day since they took control of the House in 2011 until now.
Their success in corralling federal spending is a feat unparalleled in my lifetime. The GOP’s work to block Obama’s spending should be cause for major celebration from serious fiscal hawks. Unfortunately, conservatives don’t seem to even know that this has happened, much less how to celebrate these wins. The narrative of a feckless “Establishment” betraying the electorate is more potent than the facts on the ground.
*The US budget fiscal year starts in October of the previous year. So, for example, the 2011 federal budget actually covered spending from October 1, 2010 until September 30, 2011. So it was already in effect before the Republicans were even elected in 2010 and was already a quarter over by the time they took office in 2011. The first budget they were able to influence was the 2012 budget.
UPDATE: Some people have asked for the data from which I drew these conclusions. For budget projections, I used the projections included in the official budget proposal the President issues every year. For the actual spending, I used the historical tables included in the budget proposals in the link above and also the monthly Treasury report, which is the “final” accounting of what the federal government spends month to month.
Matt is a software engineer, data vis designer, genetics data hobbiest, and technical educator based in Seattle. He tweets under @politicalmath, where he is occasionally right about some things.


Gee, and I thought we had a budget deficit pushing $20 trillion! Good to hear we’re "winning the spending war!"
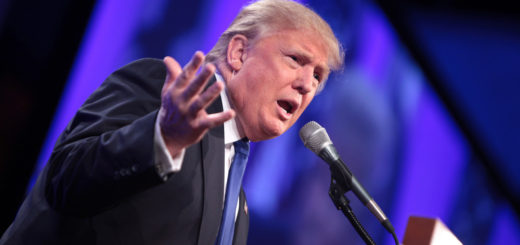
Does anyone wonder why Trump is ascendant?*
Crap like this.
Discretionary spending is only 37% of the Federal Budget.
https://www.cbo.gov/publication/43155
While the Federal deficit is shrinking
http://thf_media.s3.amazonaws.com/infographics/2012/10/SR-fed-spending-numbers-2012-p4-chart-4_HIGHRES.jpg
It’s only because Federal revenues are skyrocketing.
http://www.peakprosperity.com/files/u4/ed_revenue_increases_in_2011_budget_infl_adj.jpg
Let’s look at the Federal Debt while we are here
http://www.usdebtclock.org
Is this some sort of Pyrrhic victory? We saved 2.5 Trillion?
We’re only going over the fiscal cliff at 50 rather than 60 mph!
There’s also this, genius: Opportunity cost. Figure out if the GOP actually possessed some huevos and got rid of Medicare as well! Or reformed Social Security when they had the chance.
*I’m a Cruz supporter
The debt is still 17 Trillion, or 19 Trillion or whatever! Nobody wins when this is the case.
I think a better metric would be "Federal Government Spending as a % of GDP" or "Federal Government spending per Citizen". I don’t think it’s unreasonable for federal spending to increase at a similar or slightly lower rate than the rates at which GDP or population increase.
http://www.usgovernmentspending.com/federal_spending_chart
I haven’t verified the data on these charts, but if true, federal spending as a proportion of GDP FELL for FOUR STRAIGHT YEARS.
I’m willing to bet that most people who still can’t see any silver lining in the past few years of budgets have an answer for the question, "What proportion of GDP should government spending be?" My own answer is "No greater than 10%" The past four years have moved us incrementally closer to that. So that’s something to celebrate.
"For example, Bush’s last budget proposal showed a federal government that was on track to produce a balanced budget within a few years."
Given that this proposal was released before the Great Recession, I’m not sure this is terribly relevant.
This is true…
Except for in the last year, when the GOPe has decided to stuff the Sequestration and go hog wild.
Is my memory incorrect when I recall that Obama/Pelosi/Reid passed the "stimulus" in 2008 which was then baked into the baseline of the federal budget (through the acquiescence of the feckless Boehner-led House)?
Okay, guy. Make your case starting the first graph in 2007. You can’t, so you didn’t try.
I call shenanigans on this.
I’m not sure about the value of comparing actual spending to "a curious document that acts as part wishful thinking and part a projection of hope into the future." I need more information. In light of the recession, was his projection somewhat tempered? Was it much fantasy? And accordingly was it an act of political bravery to not go along with it? How about previous presidents’ first projections versus actual spending? Compared to non-partisan spending projections before Obama, how did we fare?
Um, spending wasn’t cut, the rather absurdly large projections of increased spending were cut. Actual spending increased every year.
This is factually untrue. I leave it to you to figure out which year saw an actual decrease in spending.
If you can’t tell me which year it was, then we know that you were unable to even find the data.
Furthermore, not only was no spending cut, but the last years of the Bush admin, it increased so absurdly that it more than made up for lower increases during Obama’s tenure.
Better comparison is spending as % of GDP and esp vs revenue. Deficits have been declining but historically high with further improvement unlikely.
But Boehner is panned because he promised in 2010 to reduce absolute spending by 100 Billion in 2011 on path to returning to 2008 spending level (about 600 Billion absolute cut).
So what! We are still bleeding. More slowly perhaps, but I am not inclined to celebrate until we actually don’t have a deficit and are paying down our debt. This is just some small accomplishment toward the real goal. It’s like celebrating after getting a B in a tough class but you still have 3 years of college ahead of you. Pat on the back, but still a long way from graduation.
Thanks for posting this. I had no idea.
It should also be noted that most in the 47% would have been delighted by unlimited spending increases, since we’re addicted to printing & borrowing money, and the funds that are raised through taxes don’t come from them anyway. They will read your story and think, "what a shame."
A little late to the party here, but an excellent post.
I am an advocate for a divided government voting heuristic on my blog. One reason for my voting preference, is that it is a historical, statistical fact that federal spending is documented to be restrained under divided government vs either unified GOP or Democratic governments. Your post points out the most recent evidence for that fact.
No, divided government does not offer the (unrealistic) radical restructuring of leviathan that many on the right would prefer. It just works in a reliable incremental fashion to moderate the worst impulses of both parties. That’s good enough for me.
And BTW – Welcome to the United Coalition of the Divided!
http://www.dividist.com/2016/04/united-coalition-of-divided-2016-edition.html
Paradox is an amazing blog of project. On this project much things are discuss that are about the public privileges and government rules. This is extremely informative information for us and very good point of conversation.